
We know there’s always a struggle to explain SEO to your agency clients. An abundance of graphs and tables can confuse them, while not presenting enough data can make them suspicious.
A lot of ink was used to explain the advantages of data visualization as a good way of presenting your pitches, results, issues, etc. and you’re already familiar with its principles and implicit psychological patterns. Yet, what can become a struggle is making those data sets compelling while implicit biases and fallacies may muddle the proverbial waters on both sides – agency and client.
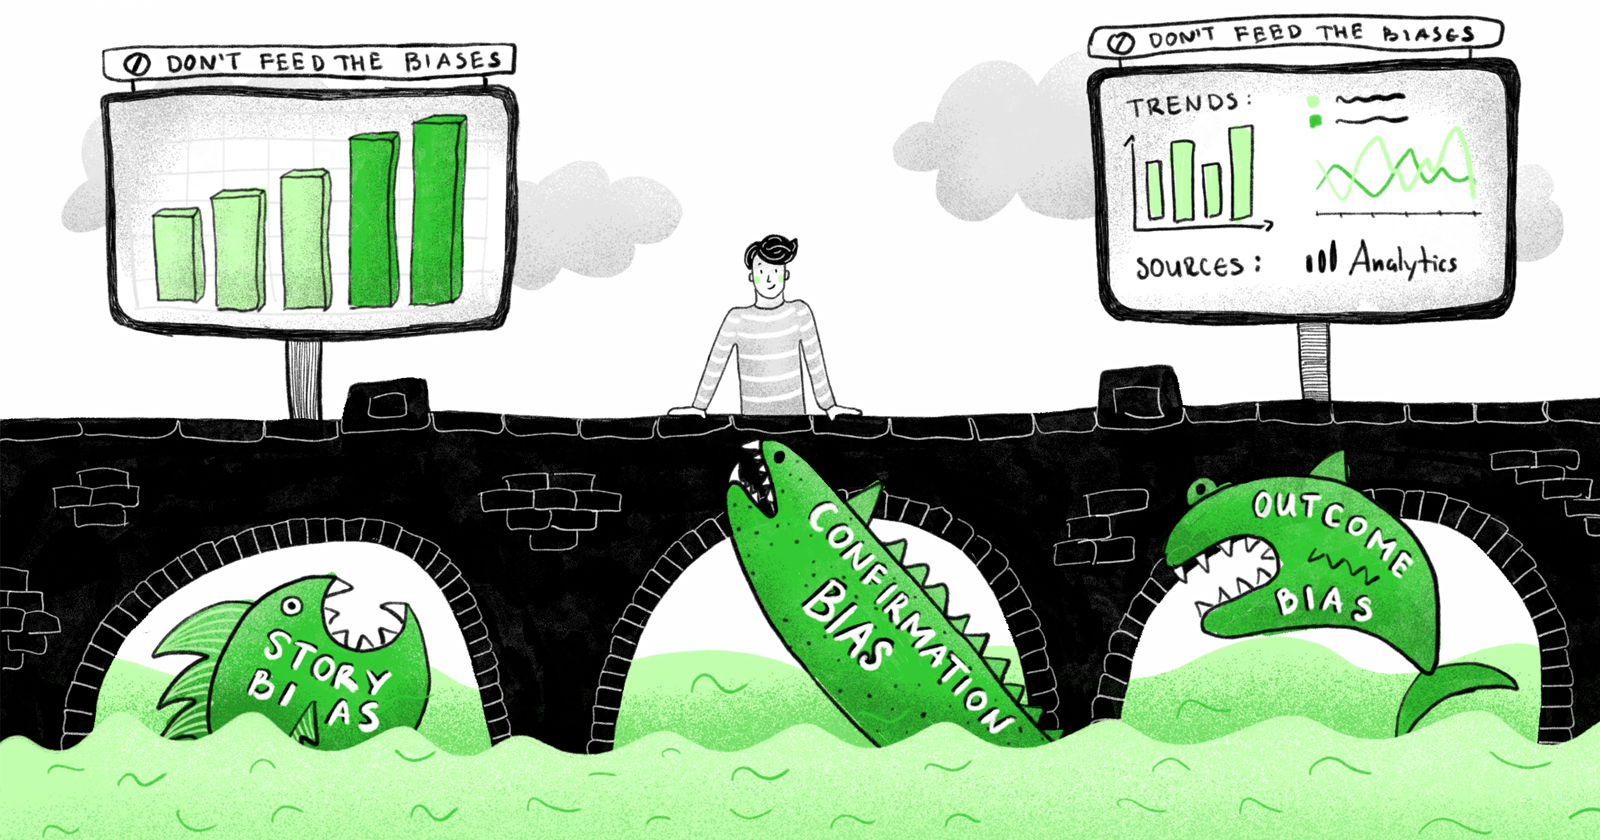
So making our known unknowns conscious and our blind spots visible, let’s take a look at our ways of thinking and how the Tufte principles behind data visualization manage to break biases and fallacies – improving communications and relationships.
The Tufte Principles Relevant to SEO Agencies
How would Edward Tufte, the American statistician and a pioneer of informational graphics, go beyond the screenshots involved in client communications and make data presentations visually appealing and accurate?
After all, he designed six principles focused on making the most of quantitative data, keeping in mind what you want to do with it, who you’re making the argument for, and what you’re trying to prove.
As you’ll see in the following paragraphs, they appear quite simple and common-sensical, and you’re probably using them in your day by day actions. So, this is an invitation to revise them, with a different lens in mind:
How can they be misunderstood or misrepresented in practice?
Your SEO team wants to paint a clear picture of the campaign’s reality for your clients, so no cracks should remain.
This is a good checklist when going about a report or presentation:
Show Comparisons
Show data by comparison to highlight relevant contrasts and make the case for the bigger forces at play. Like how search intent changed from one month to another during the pandemic.
Show Causality
Another one that involves making the case for the context at large and its variables: show how specific data influence other data. One simple example in SEO is seasonality that influences particular search volumes during Christmas, for instance.
Present Multivariate Data
Explain a complex narrative/context with a variety of data for better comprehension. When you’re forecasting, you’re including keywords, search volumes, seasonality, and so on, to present a complete overview.
Use Integrations
It’s important to present information in more ways than one (texts, numbers, formulas, etc.) and make sure you have each variable named or a legend for clarity. For instance, when you present a particular trend, you’ll include the name of the variables, a graphical representation, how it’s measured, and why it matters.
Establish Credibility (Document Everything)
Include data sources, explanations of measurements, titles, etc. Again, make sure you have the relevant information presented in a relevant way for your audience for the sake of transparency and straightforward communication.
Focus on Content (Always Give Context)
Show the most relevant data in the context of its reality. Make sure your audience understands what you’re referring to and the before/after process implied in the argument. Present your process.


Comments (0)